How to Check Instagram Analytics to Grow Your Account
How to Check Instagram Analytics to Grow Your Account
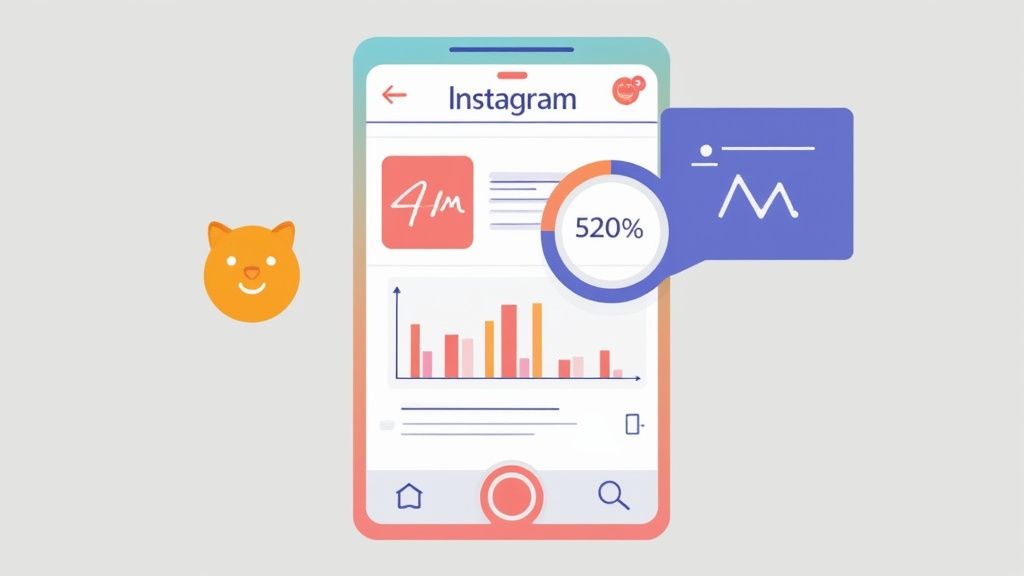
First things first, you can't check your analytics without a Business or Creator account. If you're still on a personal profile, make the switch. Once you do, you'll unlock the Insights tab on your profile, which is where all the magic happens. This dashboard is packed with data on your audience, content performance, and overall reach.
Why Your Instagram Analytics Are So Important
Before we get into the nitty-gritty of how to find your stats, let's talk about why they're a game-changer. Flying blind on Instagram is a common mistake. You post content, cross your fingers, and hope something sticks. Analytics turns that guesswork into a real, results-driven strategy.
Think of it this way: top creators and brands aren't just getting lucky. They're making smart decisions every single day based on what their data tells them. The numbers tell a story about who your audience is, what they love, and what makes them scroll right past. This information is your roadmap to genuine, sustainable growth.
Transform Data Into Decisions
Your analytics are what help you look past vanity metrics—like a ballooning follower count—and focus on what actually moves the needle for your brand. When you understand what drives real engagement, you can stop pouring energy into content that goes nowhere and double down on the stuff that works.
This data-backed approach lets you:
Pinpoint Your Best Content: Find out which posts, Reels, or Stories get the most saves, shares, and comments. These are huge clues about what your audience truly values.
Actually Know Your Audience: Get a clear picture of your followers' age, gender, and location. Even better, you can see the exact days and hours they're most active.
Sharpen Your Content Strategy: Spot trends in your performance to build a content calendar that hits your audience when they're ready to engage, maximizing your impact.
The real secret is creating a feedback loop: Post. Analyze. Learn. Adapt. It’s this constant cycle of refinement that builds a powerful and engaged community over time.
At the end of the day, knowing how to check your Instagram analytics makes your efforts smarter, not just harder. It’s the only way to truly understand the ROI of social media marketing and make sure your time on the platform is time well spent.
Quick tip
Want to save 10+ hours a week on content?
Outbrand uses AI to generate a full month of on-brand social media posts in minutes. Join 1,000+ marketers who've already made the switch.
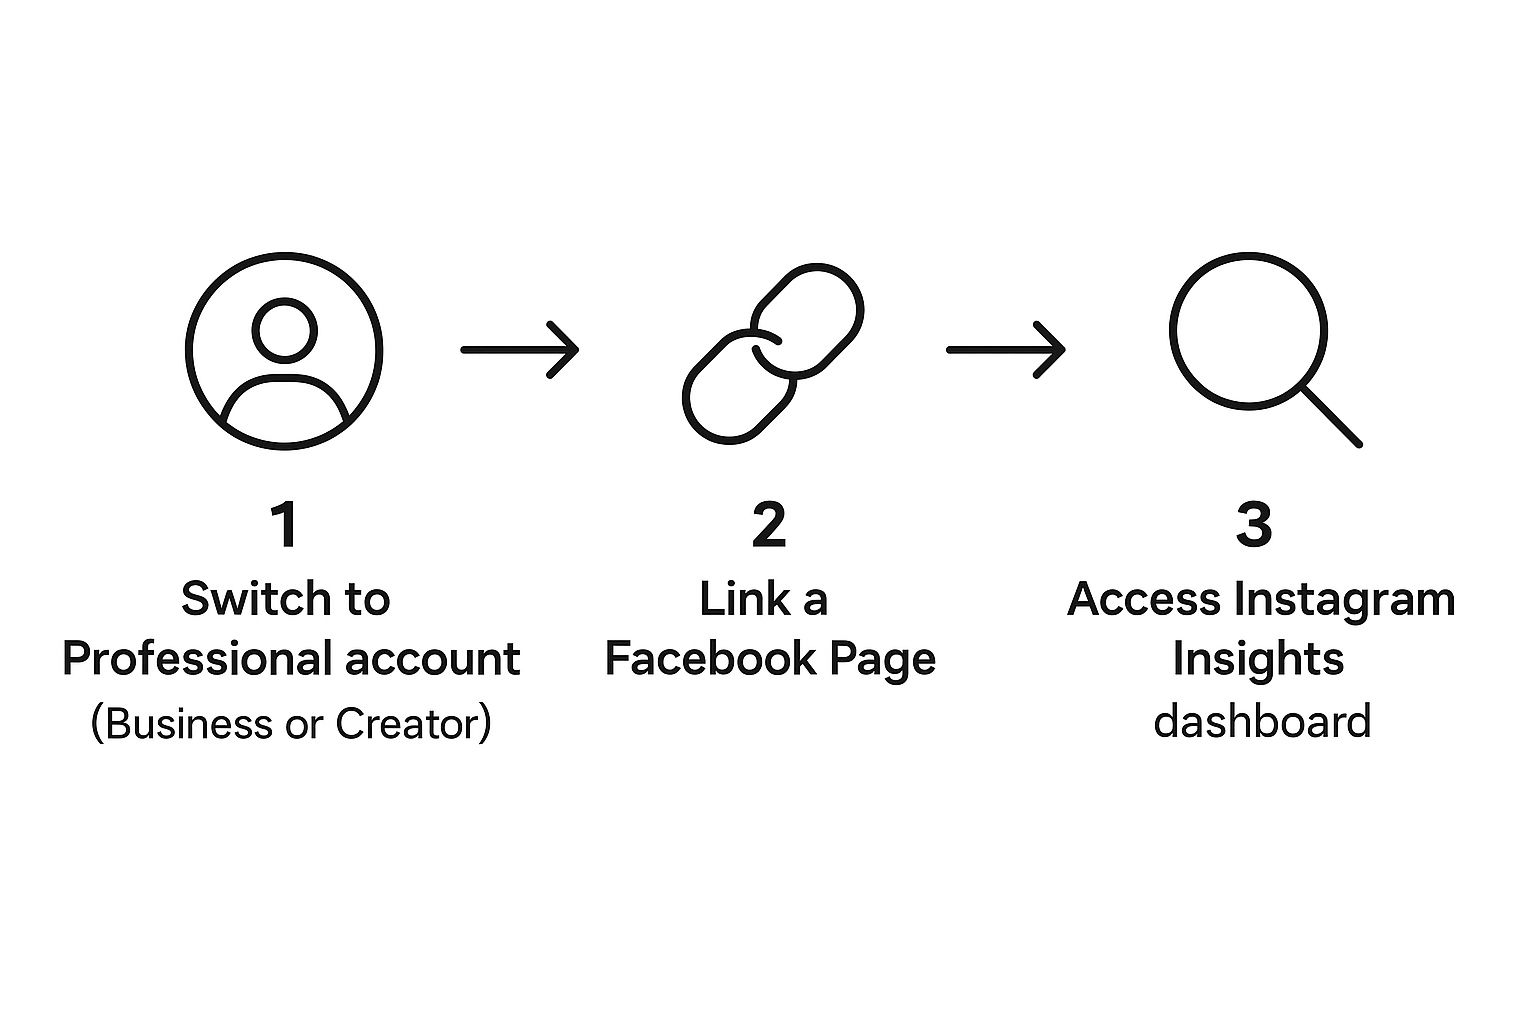
Before you can dive into any analytics, you have to flip the switch. Instagram keeps its powerful data tools, known as Insights, locked away from personal profiles. To get the key, you need to convert your account to either a Business or Creator profile.
This isn't just a suggestion; it's a mandatory first step. Think about it—with nearly 2 billion people scrolling through Instagram every month, you can't afford to guess what's working. Making this switch is how you start making data-driven decisions. You can get a deeper sense of the platform's scale from these global social media statistics.
The good news? It's a quick and painless process you can do right from your account settings.
As you can see, it's really just a few taps to get your account converted and start seeing what's happening behind the scenes.
Should You Choose a Business or Creator Account?
Okay, so which professional account is the right fit? It really boils down to who you are and what you're trying to accomplish on the platform.
Business Account: This is your go-to if you're a brand, a local shop, a service provider, or an organization. It's built for commerce and comes with features like a physical address on your profile, contact buttons (call, email, directions), and the full suite of advertising tools.
Creator Account: This one is designed for individuals—think influencers, artists, public figures, and content producers. It gives you more control over your profile's appearance and offers slightly different metrics that are more focused on personal brand growth and audience trends.
For most businesses and marketers reading this guide, the Business account is the clear winner. It’s equipped with all the commercial features you need to measure ROI and drive sales.
If there's one thing to take away here, it's this: Switching to a professional account is the single most important action you can take to move from guessing to knowing what resonates with your audience. It instantly turns your profile into a powerful analytical tool.
Once you’re ready, just head over to your account settings. The option is easy to find. This simple tap is your gateway to unlocking a goldmine of performance data.
How to Find and Navigate Instagram Insights
Alright, now that you've got your professional account set up, the real fun begins. You've unlocked a treasure trove of data. I know opening Instagram Insights for the first time can feel like you’ve just stepped into an airplane cockpit—a bit overwhelming, right? Don't worry, it's actually much simpler than it looks. Let's walk through where to find everything, both on your phone and your computer.
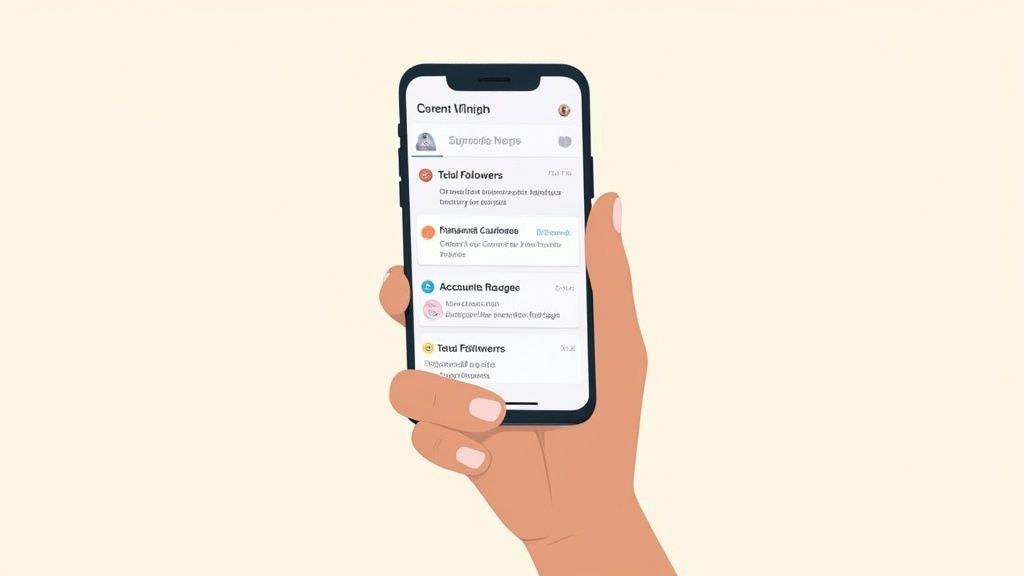
Your main spot for a quick analytics check will be right inside the Instagram app. Just head to your profile page and tap the “Insights” button sitting right under your bio. One tap is all it takes to get a solid overview of how your account is doing.
Your Mobile Analytics Dashboard
Once you're in the main Insights dashboard, you’ll find your data broken down into a few core areas. Think of these as the main chapters of your performance story, usually covering the last 7, 14, 30, or even 90 days.
You’ll immediately see a few key sections:
Accounts Reached: This is the big one. It tells you how many unique people saw your content. It even splits this into followers and non-followers, which is perfect for seeing if you're actually reaching new audiences.
Accounts Engaged: This metric shows you how many people are actually interacting with your stuff—think likes, comments, shares, and saves. This is your reality check on whether your content is just being seen or if it's genuinely connecting with people.
Total Followers: Here’s where you can watch your community grow. You can dig into where your followers are from, their age ranges, and—my personal favorite—when they’re most active online.
Pro Tip: Don't just skim these overview numbers. Tap into each section. For instance, digging into the "Total Followers" area shows you a chart of the peak active times for your specific audience. This is gold for figuring out the absolute best times to post for maximum impact.
Finding Data on Your Desktop
When you need to do a deeper dive and have more room to work, the Meta Business Suite is where you want to be. Once you link your Instagram account, you'll find a much more detailed and powerful analytics dashboard. I find the desktop view is way better for generating reports or comparing performance over custom timeframes.
On your desktop, it's also much easier to analyze how a specific piece of content performed. You can really get into the weeds on individual Posts, Stories, or Reels and see metrics like Profile Visits, Website Taps, and Saves for each one.
Here’s a real-world example: let's say you notice one of your Reels brought in a huge spike in profile visits. That's a massive clue. It means that specific content style made people curious enough to check out who you are. This is exactly how you figure out what's working so you can do more of it.
Decoding the Metrics That Actually Matter for Growth
Opening Instagram Insights for the first time can feel overwhelming. With dozens of numbers staring back at you, it’s tempting to focus on the wrong things. The secret isn't tracking everything—it's understanding which metrics are true signals of growth and a healthy, engaged community.
Let's move past vanity metrics like total followers and likes. Sure, they feel good, but they don't tell the whole story. Real growth is hidden in the deeper signals your audience sends through their actions. Metrics like Saves, Shares, and Profile Visits are where the real gold is.
Beyond Likes: The Engagement Metrics That Count
Think about the user's intent. A "like" is a quick, passive nod. It’s the lowest-effort interaction someone can have with your content.
A Save, on the other hand, is a deliberate action. When someone saves your post, they're bookmarking it because they see long-term value in it. This is a massive clue that you've created genuinely useful, evergreen content.
Even better are Shares. A Share is a personal endorsement. It means someone found your content so compelling they were willing to send it to a friend or post it to their own Story, extending your reach to entirely new audiences organically.
A single Share can be more valuable than a hundred Likes. It’s a direct referral from a trusted source, which is far more powerful than a simple double-tap.
Imagine you post a Reel that gets a modest number of likes but an unusually high number of Shares. That’s a huge strategic insight. It tells you the format and topic were highly relatable and have viral potential. Your next move? Make more content just like it.
Essential Instagram Analytics Metrics Explained
To help you cut through the noise, I’ve put together a table of the most important metrics you'll find in your Insights. Think of this as your cheat sheet for understanding what your audience is really telling you.
Metric
What It Measures
Why It's Important
Reach
The unique number of accounts that have seen your content.
This tells you how widespread your content's visibility is, beyond just your existing followers.
Saves
The number of times your post has been bookmarked.
A strong indicator of high-value, evergreen content that your audience wants to revisit.
Shares
The number of times your content was sent via DM or shared to a Story.
Measures the virality and word-of-mouth appeal of your content. Shares are a powerful endorsement.
Profile Visits
The number of people who tapped through to your profile from a specific post.
Shows how effective your content is at sparking curiosity and driving people to learn more about you.
Follower Growth
The net change in your follower count over a specific period.
Tracks the momentum of your account's growth and helps identify what content attracts new followers.
Website Taps
The number of taps on the website link in your bio.
A crucial bottom-of-the-funnel metric that measures how well Instagram is driving traffic to your site.
By focusing on these specific numbers, you shift from just counting likes to building a real strategy based on audience behavior.
Tracking True Audience Connection
Knowing how to check Instagram analytics for metrics that reveal a deeper connection is more important than ever. Organic reach is getting more competitive, and engagement rates are reflecting that. In fact, one report showed a 28% drop in average engagement from 2023 to 2024, partly due to algorithm changes and the sheer volume of content. You can dig into more social media benchmarks on Socialinsider.io.
To stay ahead, focus on metrics that measure audience intent and growth quality:
Profile Visits: How many people were intrigued enough by a post to click to your profile? A high number here is a strong sign your content is an effective hook for your brand.
Follower Growth Rate: Don't just obsess over the total follower count. Calculate your growth rate (new followers divided by total followers) to get a more accurate picture of your momentum.
Website Taps: For any business, this is a bottom-line metric. It tells you exactly how well your Instagram is driving traffic to your product pages or blog.
When you shift your focus to these deeper metrics, you stop measuring visibility and start understanding what truly resonates. For more on this, check out our guide on how to measure social media engagement. This approach turns your analytics from a simple report card into a strategic roadmap for creating content your audience genuinely loves.
Turning Your Instagram Data Into a Winning Strategy
Knowing your numbers is one thing, but the real magic happens when you use that data to build a roadmap for growth. This is where you move from just checking analytics to actually building a smarter, more effective content plan.
Think of your data as a cheat sheet for what your audience truly wants. Instead of guessing or posting whenever you feel like it, you can schedule your content around the specific days and hours your followers are scrolling. It's a simple change that can dramatically increase how many people see your posts right away.
For example, what if your insights show that carousel posts consistently get the most Saves? That’s a huge clue. It tells you that your audience finds that format super valuable and wants to come back to it later. The next logical step? Start creating more in-depth, educational carousels that directly solve their problems.
Create a Data-Driven Feedback Loop
The most successful Instagram accounts I've seen all run on a simple cycle: post, analyze, learn, and adapt. This feedback loop ensures your strategy is constantly improving based on what’s actually working, not just what you think should work. Let the data be your creative director.
Here’s how to put this into practice:
Find Your Winners: Pull up your posts from the last 30 days and sort them by Reach or Shares. What do the top ones have in common? Was it the topic? The format (like a Reel vs. a static image)? Or maybe a certain tone in the caption?
Check Audience Habits: Head over to the "Total Followers" section to find the exact times your audience is most active. These are your prime-time slots. Schedule your most important content to drop right in those windows.
Test and Tweak: Try experimenting with one new thing at a time. For instance, you could test out a different call-to-action in your next few posts and see if it boosts your Website Taps.
Your analytics dashboard isn't just a report card; it's a dynamic instruction manual written by your audience. Every metric is a vote for the kind of content they want more of. Listen to it.
Once you have these insights, building a plan around them is key. To get everything organized, it helps to learn how to build a social media content strategy template to keep all your efforts focused and on track.
To really nail your timing and stay consistent, using social media scheduling tools is a game-changer. Automating your posts for peak hours frees you up to spend more time creating the content your audience is clearly asking for. This systematic approach is how you turn casual viewers into an engaged community.
Got Questions About Instagram Insights? Let's Clear Things Up.
As you start digging into your Instagram analytics, it's totally normal for a few questions to pop up. The data can feel a little overwhelming at first, so let's tackle some of the most common things that trip people up.
How Far Back Does My Instagram Data Go?
This is one of the first things people want to know. The moment you switch to a Business or Creator account, Instagram starts tracking everything.
However, a key thing to remember is that the in-app Insights tool generally only shows you the last 90 days of data. If you need to look at performance over a longer period, you'll have to hop on a desktop and use the Meta Business Suite.
Why Do My Numbers Look Different in Different Places?
You've probably noticed this: the Reach on your main dashboard doesn't match the sum of your individual post reaches. This isn't a glitch, it's just a different way of measuring.
Think of it like this: your main dashboard shows your total unique reach over a set period (say, 30 days). An individual post’s reach is just for that one piece of content.
So, if one person sees five of your posts this month, they are counted just once in your total account reach but counted for each of the five posts they saw.
The overview gives you the big-picture health of your account, while the post-level data tells you what’s working on a case-by-case basis. Both are valuable, just for different reasons.
Quick Answers to Common Sticking Points
Here are a few other rapid-fire answers to questions I hear all the time:
Can I see who saved my post? Nope. Instagram keeps this private to protect user privacy. You can only see the total number of saves, not a list of who did the saving.
What happens to analytics if I delete a post? It's gone for good. When you delete a post, all its data—likes, comments, reach, everything—is permanently wiped from your overall analytics.
Why don't my old posts have any Insights? Instagram only starts collecting data from the moment you convert to a professional account. Any photos or videos you published back when you had a personal profile won't have any analytics attached to them.
Getting a handle on these nuances is the key to reading your data correctly and making smarter decisions about your content.
Ready to stop guessing and start growing? Outbrand uses AI to instantly generate a complete, on-brand 30-day social media calendar with captions, images, and strategy. Get your content plan done in minutes.